Strategy Game Dashboard
I’ve been playing Teamfight Tactics (TFT) on and off and enjoy
the strategic depth of the game. Out of curiosity, I explored Riot’s developer
API to see if I could access my own match data and build a personal dashboard
in R. TFT is an auto-battler strategy game where players compete by assembling
teams of champions with different traits and items, making data about
performance and history especially interesting to analyze.
The biggest challenge was understanding how Riot structures its data and
identifying the right endpoints and fields. Using the REST API and an API key
from the Riot Developer Platform, I retrieved and processed the raw data, then
transformed it into visual insights through a custom dashboard.
While there are many existing dashboards—some far more advanced—this project
was primarily a personal challenge driven by curiosity and a chance to practice
working with APIs and data visualization in R.


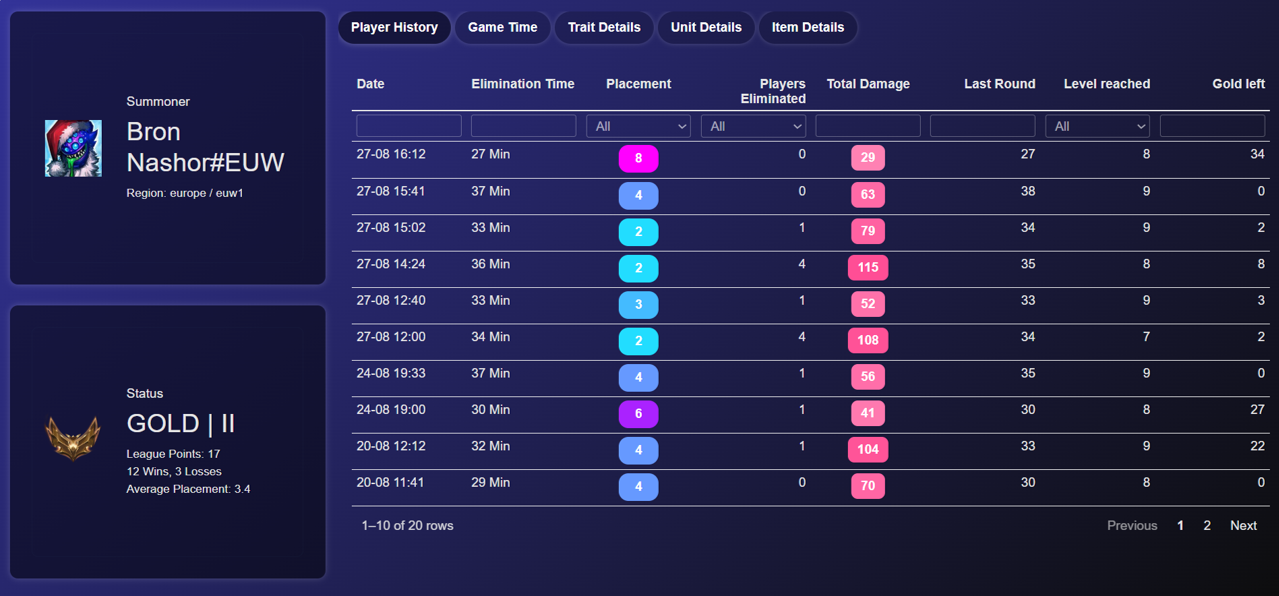 player's match history
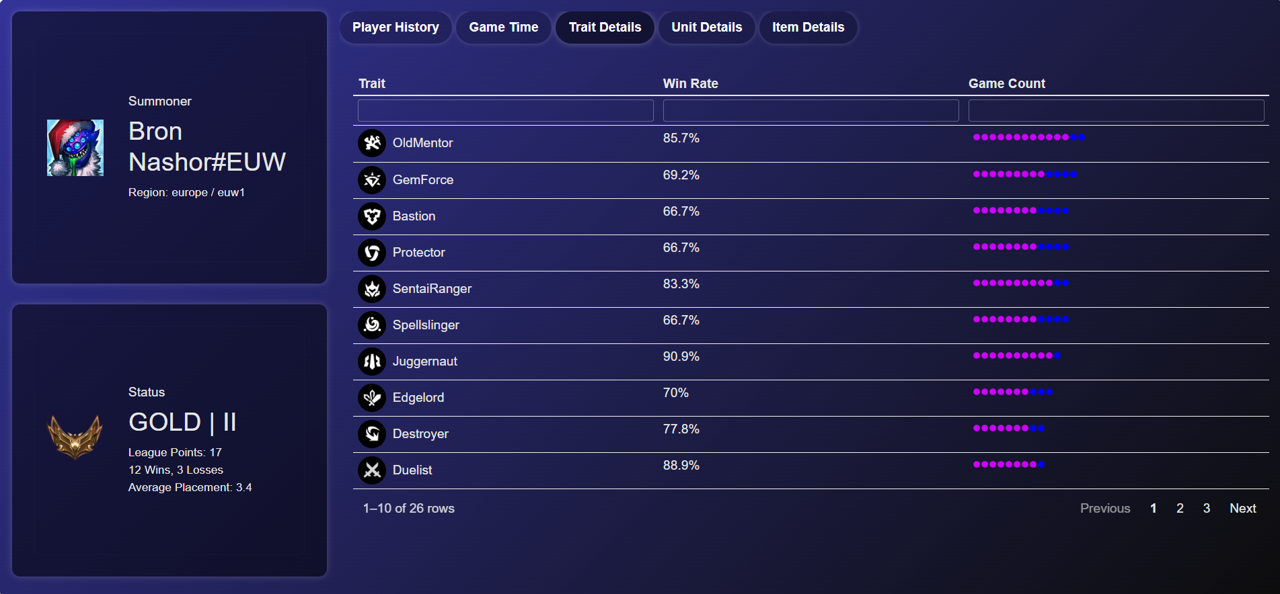 player's selected traits and win rates
The dashboard is built in R and rendered as a standalone HTML file. Data fetching, processing, and visualization are separated across multiple scripts:
- Data Handling (get_data.R): Handles API calls, data extraction, and aggregation for player stats, match history, traits, units, and items. Implements functions to process lists of matches and structure data for visualization.
- Dashboard Rendering (report_script.R): Generates interactive tables and charts using reactable and plotly. Includes inline mini-bar visualizations for units, items, and traits. Customizes layout and styling with bslib.
- Styling (styles.scss): Provides a modern, responsive UI with semi-transparent panels, rounded corners, and consistent color theming.
- Deployment (index.html + lib folder): Produces a fully self-contained HTML dashboard, ensuring all dependencies and assets load locally without requiring an external server.
The dashboard is designed primarily for desktop use and is not yet fully optimized for mobile layouts. While the data retrieval from Riot’s API is accurate, some calculated statistics—such as win rates—may be less representative when based on a limited number of matches. In the future, given more time, the project could be extended to include additional metrics, deeper insights, and broader use of the available data.
Data/Icons Sources:
ddragon.leagueoflegends.com
raw.communitydragon.org
MetaTFT CDN
developer.riotgames.com/